Shoresy

Trial of Debbie

Shoresy · 9 months ago

I actually ran all his thread-ending non-sequiturs through AI analysis, and the AI said the responses were generally designed to end the discussion. Objectively, if you scroll through every category, nearly every thread has ended on a Debby non-sequitur conversation-ending post.


What would be hilarious is if someone programmed an AI bot to compete with the Debby AI program for thread-ending non-sequiturs. The traffic and slop spam would be off the charts.

Shoresy

You had it right at political bot.


The regression of US political tribalism is fueling a race to the bottom.

Nearly every branch of the US government is co-opted with activists on both sides, leaving little room for competent people.

That's how your country ended up with Kamala, Biden, Trump, and AOC. Obama ran on being a community activist, and he delivered. Big time.


Shoresy

You know what actually takes voter rights away? When you have zero safeguards accounting for election fraud.

Declaring elections secure with no verifications is the same as declaring the US border secure after you turn the cameras off.

Security and integrity require robust systems of control, not reduced controls...

Shoresy

There's an argument to be made that WW2 was just a continuation of WW1, which was also a continuation of the Napoleonic wars, which was also a continuation of....


The Marshal Plan era was the first time Europe experienced real pacifism and not Pax Romana, however; it took Fat Man and Little Boy to get all of EU to agree to follow the plan. Peace through the atom got EU to agree on real pacifism. I suspect a worldwide existential event like Aliens would be necessary for pacifism to be global.

Shoresy

For New York City (household income Gini):

1970: roughly 0.43–0.45 (estimates vary slightly by dataset)

2020: roughly 0.54–0.55

NYC has consistently ranked as one of the most unequal large cities in the United States.

For perspective:

• U.S. overall (2020): ~0.49

• NYC (2020): ~0.54–0.55

• Manhattan alone: even higher (~0.60+ in some years)


It's okay if you get more joy from chanting political slogans, as data is quite boring to look at.


You do not understand correlation vs causation


Whatever New York has been doing under mostly one tribe rule for 50 years, compared to the rest of the country, is not working.

But today's Democrat is tomorrow's Conservative. "Let's keep doing more of the same ancient things your ancestors did."


Shoresy

To be fair, it wasn't you who was spouting nonsense about how government interventionism has had such a great track record in your country over the past 50 years.


You just need to be careful, just because someone is in your tribe does NOT mean you should just nod along without stopping to think about the facts. Sometimes it's actually okay to push back. And if it's not OK to push back, that's a good sign your tribe is a cult.


The data on New York City is really unrefutable. The GINI numbers are either real or they are not.

Shoresy
I already refuted your uninformed blue state argument and explained to you step by step by step why the wealth gap will never be solved without government intervention.


You mean "has gotten worse over 50+ years in places with government intervention."


not "is getting solved over 50+ years in places with government intervention."

No metric shows that it "is getting solved" over the past 50+ years with increasing government intervention.

It's actually much worse today than 1970. You can chant the political slogans your tribal leaders push, but the data doesn't track the slogans.


For New York City (household income Gini):

1970: roughly 0.43–0.45 (estimates vary slightly by dataset)

2020: roughly 0.54–0.55

NYC has consistently ranked as one of the most unequal large cities in the United States.

For perspective:

• U.S. overall (2020): ~0.49

• NYC (2020): ~0.54–0.55

• Manhattan alone: even higher (~0.60+ in some years)


It's okay if you get more joy from chanting political slogans, as data is quite boring to look at.


The objective result with your blue states is increased wealth inequality over 50 years, not decreased as advertised.


Yes, now we agree.

Shoresy
You could see Hitler not wanting to murder rednecks if he was in charge of America.


That's fundamentally untrue. Hitler was obsessed with phrenology so much that it transcended skin color. He genuinely thought Germans got their culture from their genes, and any non-German white was either unfit to live or unfit to rule. Especially rednecks.

Shoresy

It's too bad America ruined the original idea behind the Poll Tax before it was subverted to support segregation.


It was rooted in older political philosophy: that suffrage should be tied to property, taxation, or financial contribution. A voter should have a tangible stake in the system they’re helping to govern. Early American voting rights were often restricted to property-owning men anyway. The poll tax was just a simpler, more scalable version of that mindset.


Oh, and repeal the 19th is also a thing.

Shoresy

Maybe there should be a thing measuring cultural IQ. Most Foundational African Americans are not much different culturally from White Rednecks, since that was the culture their ancestors came from.

Shoresy

First, redefining inequality mid-argument is like turning your own echo into evidence. If the definition shifts depending on which political geography you’re defending, you’re not measuring reality — you’re sculpting it.

Second, when someone says “it depends how you measure inequality” and then proceeds to choose the measurement that confirms their prior, that’s not nuance. That’s calibration to narrative.

Third, if inequality is framed only as post-tax income dispersion, you erase asset inflation. If it’s framed only as poverty rates, you erase top-end concentration. If it’s framed as nominal dollars, you ignore purchasing power. Selective framing is not neutral.

Fourth, screaming into the wind just to hear your own voice is what happens when metrics become moral theater. The number isn’t the goal — the confirmation is.

Fifth, over fifty years, the largest blue urban centers have experienced rising inequality despite expanding social programs. That should at least complicate the “more intervention = less inequality” story.

Sixth, one reason: asset inflation. Since the 1970s, monetary policy, financialization, and global capital flows have dramatically inflated equities and real estate. Blue cities host those asset markets. Intervention didn’t stop capital concentration — it often amplified it.

Seventh, zoning and land-use regulation in many blue cities has constrained housing supply. When demand rises and supply is artificially tight, prices explode. That widens wealth gaps mechanically.

Eighth, agglomeration economics. High-skill industries cluster. When tech and finance concentrate in cities like New York, San Francisco, Boston, Seattle, the wage distribution stretches. Government intervention didn’t create clustering, but it didn’t prevent it either.

Ninth, credential inflation. Blue cities often anchor elite universities and knowledge economies. That produces extreme wage premiums for specialized labor while service sectors remain low-wage.

Tenth, progressive tax policy can compress disposable income inequality somewhat, but it does little to reverse structural asset inequality. Capital appreciation outpaces redistribution.

Eleventh, welfare expansion reduces extreme poverty but doesn’t eliminate dispersion between median earners and equity-rich households.

Twelfth, globalization disproportionately benefits port cities and financial hubs. Blue cities are tied into global capital circuits. That integration widens top-end income share.

Thirteenth, venture capital ecosystems generate outsized windfalls for a small subset of founders and early employees. That kind of wealth event did not exist at scale in 1970. It’s now common in blue metros.

Fourteenth, regulatory barriers to entry in certain industries protect incumbents. That can entrench wealth rather than diffuse it.

Fifteenth, property-based tax systems reward long-term homeowners while renters fall further behind as prices climb.

Sixteenth, federal monetary policy has favored asset holders for decades. Blue cities have more asset holders at scale. That compounds concentration.

Seventeenth, immigration flows into global cities create large low-income labor pools alongside high-income professional classes. That mechanically widens the bottom-to-top gap.

Eighteenth, public-sector employment growth stabilizes incomes but does not generate equity wealth. Private capital accumulation still dominates inequality metrics.

Nineteenth, social safety nets prevent collapse but do not flatten the distribution curve created by financial markets.

Twentieth, so if inequality rises for fifty years in intervention-heavy cities, the honest response isn’t to redefine the metric — it’s to ask whether structural capital dynamics overpower redistribution tools.

Twenty-first, redefining inequality to defend governance is like adjusting the thermometer to avoid admitting it’s cold.

Twenty-second, if the policy thesis is “intervention reduces inequality,” but the inequality line keeps climbing in intervention-dense cities, either the intervention is insufficient, misdirected, or the mechanism misunderstood.

Twenty-third, it’s possible to reduce absolute deprivation while increasing dispersion. Those are different phenomena. Conflating them confuses debate.

Twenty-fourth, if asset appreciation is the dominant inequality driver, then wage-focused redistribution won’t fully address it.

Twenty-fifth, screaming about Gini coefficients without addressing housing supply, capital markets, zoning, and asset bubbles is performative.

Twenty-sixth, urban inequality is as much about capital structure as it is about party ideology.

Twenty-seventh, when inequality discussions ignore purchasing power differences between regions, they become abstract rather than lived.

Twenty-eighth, if a city produces both billionaires and homelessness at scale, that is a structural economic pattern — not just a partisan talking point.

Twenty-ninth, measuring inequality honestly requires holding multiple metrics at once. Selecting only the ones that flatter your political tribe is self-soothing.

Thirtieth, and if after fifty years of intervention-heavy governance the dispersion curve remains steep, maybe the problem isn’t the measurement. Maybe it’s that capital, housing, and global flows are more powerful than local redistribution.


If after fifty years of intervention-heavy governance, the inequality curve in major blue cities keeps steepening, then the honest question isn’t whether the metric is flawed. It’s whether the intervention structure itself is interacting with market forces in ways that amplify dispersion.

Over time, large welfare states alter migration incentives. High-benefit urban centers attract low-income populations seeking services, housing support, and opportunity. That inflow expands the bottom of the income distribution numerically, increasing measured dispersion even if individual conditions improve relative to origin regions.

At the same time, benefit cliffs create marginal tax traps. When additional earnings reduce eligibility for assistance, the effective marginal rate on upward movement is steep. That doesn’t mean people are lazy — it means incentive gradients matter.

Layer on zoning constraints and land-use regulations that artificially restrict housing supply. Limited supply in high-demand cities drives asset prices upward. That disproportionately benefits property owners and early entrants while locking out new participants.

Financialization compounds this. Ultra-wealthy actors operate in global capital markets. They arbitrage regulatory complexity, exploit niche tax structures, deploy capital across borders, and access investment vehicles unavailable to ordinary earners. High-regulation environments raise barriers to entry, which incumbents can navigate more easily than small competitors.

Add network effects from tech and finance clustering. When equity-based compensation dominates compensation structures, wealth dispersion accelerates. A small number of IPO or liquidity events can shift a metro’s wealth curve dramatically.

Global capital inflows into “safe” blue metros inflate commercial and residential real estate. That’s not local policy alone — but local policy can restrict supply, turning demand into price escalation instead of expansion.

Meanwhile, heavy regulatory frameworks suppress small business formation through compliance costs. Large firms absorb those costs more easily. That concentrates market power and profits.

So the 50-year pattern looks like this:

Redistribution and welfare stabilize and flatten out the bottom.

Housing scarcity inflates assets.

Regulation advantages incumbents.

Global capital concentrates at the top.

Migration expands the lower-income base.

Voila, a recipe for increasing wealth inequality.

The result is a widening dispersion curve, not despite intervention, but shaped by how intervention interacts with capital dynamics.

That’s the argument. Not that Democrat or Republican social programs “cause poverty.” Not that redistribution is evil. But that incentive layers, migration flows, housing constraints, and financial asymmetries combine in ways that preserve or even increase inequality over long horizons.

That’s the structural thesis. Harder to dismiss than tribal political slogans.

Shoresy

Lol, AI slop wars...


First, zoom out: inequality is overwhelmingly an urban phenomenon. The biggest dispersion of income and wealth happens in dense metro areas tied to finance, tech, media, and global capital — not in rural states voting red.

Second, if you rank U.S. metropolitan areas by Gini coefficient, the highest inequality metros are overwhelmingly large blue cities: New York, San Francisco, Los Angeles, Miami, Boston, Chicago, Washington D.C., Atlanta. The common denominator isn’t party control — it’s global-city status.

Third, Manhattan alone has a higher Gini than most entire red states. That tells you the dispersion inside blue urban cores dwarfs rural dispersion in magnitude.

Fourth, San Francisco–Oakland routinely ranks near the top in metro income inequality. Massive tech wealth next to low-income service labor drives extreme spread.

Fifth, Los Angeles shows one of the widest 90th-to-10th percentile income ratios in the country. That’s structural polarization — not rural conservatism.

Sixth, New York City has billionaires concentrated in a few ZIP codes while public housing projects exist within miles. That spatial inequality is measurable in census tract data.

Seventh, Boston and Washington D.C. both rank high in income dispersion due to elite professional classes alongside lower-income immigrant populations.

Eighth, Miami — a blue-leaning urban core — consistently shows one of the highest Gini scores among large metros.

Ninth, when measuring top 1% income share, major blue cities dominate the list. High-end capital markets and tech equity compensation inflate the top.

Tenth, wealth inequality — measured by net worth dispersion — is most extreme in housing markets where asset appreciation has exploded. That’s San Francisco, Seattle, NYC, Boston, LA — overwhelmingly blue urban centers.

Now let’s stack additional metrics:

Eleventh, housing price-to-income ratios are dramatically higher in blue coastal metros. When homeownership becomes inaccessible to middle earners, wealth gaps widen structurally.

Twelfth, rent burden rates (percent of income spent on rent) are highest in blue metros. Lower-income households in these cities spend a much larger share of income on housing than counterparts in red metros.

Thirteenth, asset ownership concentration is more skewed in high-cost urban centers because equity compensation (RSUs, stock options) clusters in tech and finance hubs.

Fourteenth, income polarization indexes (measuring shrinkage of middle-income households) show sharper middle-class erosion in large coastal cities than in many mid-sized red metros.

Fifteenth, cost-adjusted disposable income often compresses inequality in red metros because lower housing costs raise real purchasing power for middle-income households.

Sixteenth, interquartile income range (IQR) spreads are wider in large blue metros due to simultaneous presence of ultra-high earners and low-wage service labor.

Seventeenth, property tax base concentration in blue cities reveals extreme valuation differences between luxury districts and working-class neighborhoods.

Eighteenth, venture capital distribution is heavily concentrated in blue metros. When startup wealth events occur, they spike local inequality metrics dramatically.

Nineteenth, homelessness rates, which often correlate with housing-driven inequality, are significantly higher per capita in major blue coastal cities than in most red metros.

Twentieth, when looking at IRS SOI data by ZIP code, income variance inside major blue cities far exceeds variance inside most red-leaning metro regions.

Twenty-first, rural red metros often show lower inequality simply because incomes cluster more tightly around modest medians — less dispersion at both extremes.

Twenty-second, blue cities attract both global wealth and low-income migration simultaneously. That dual inflow mechanically expands dispersion.

Twenty-third, in many red metros, absence of extreme capital inflows limits top-end explosion — which lowers measured inequality even if median incomes are lower.

Twenty-fourth, federal redistribution policies apply nationally, yet extreme metro inequality persists most intensely in global blue hubs. That suggests urban structure matters more than state party control.

Twenty-fifth, even within red states like Texas, the highest inequality zones are Austin, Dallas, Houston — urban, blue-leaning cores.

Twenty-sixth, the same pattern appears in Georgia: rural areas show lower dispersion; Atlanta shows high inequality.

Twenty-seventh, North Carolina: rural counties lower dispersion; Charlotte and Raleigh higher dispersion.

Twenty-eighth, when economists isolate urban density as a variable, density correlates more strongly with inequality than party governance.

Twenty-ninth, capital concentration follows agglomeration economics — high-skill industries cluster, wages diverge, asset prices inflate. That’s city-driven, not ballot-driven.

Thirtieth, so the “red states worse inequality” narrative collapses once you disaggregate to the metro level. Inequality is primarily a feature of globalized blue urban centers, not rural conservative regions.

If someone wants to argue about poverty levels, that’s a separate discussion. But on dispersion metrics — income spread, wealth concentration, housing inequality, top-share concentration — the most extreme numbers sit inside major blue cities. And using a useless filter such as "it depends on how you measure it" is only you screaming into your own ear.

Shoresy
So pick one, and say it out loud.


Thanks for agreeing exactly why, after 50 years of interventionism, the objective result with your blue states is increased wealth inequality over 50 years, not decreased as advertised. I particularly liked your agreement with market distortions, and not some hamfisted hur-durr explanation about rich people loving a tribe or state or something like that being responsible for the increases in wealth inequality over 50 years of market interventionism.

Shoresy

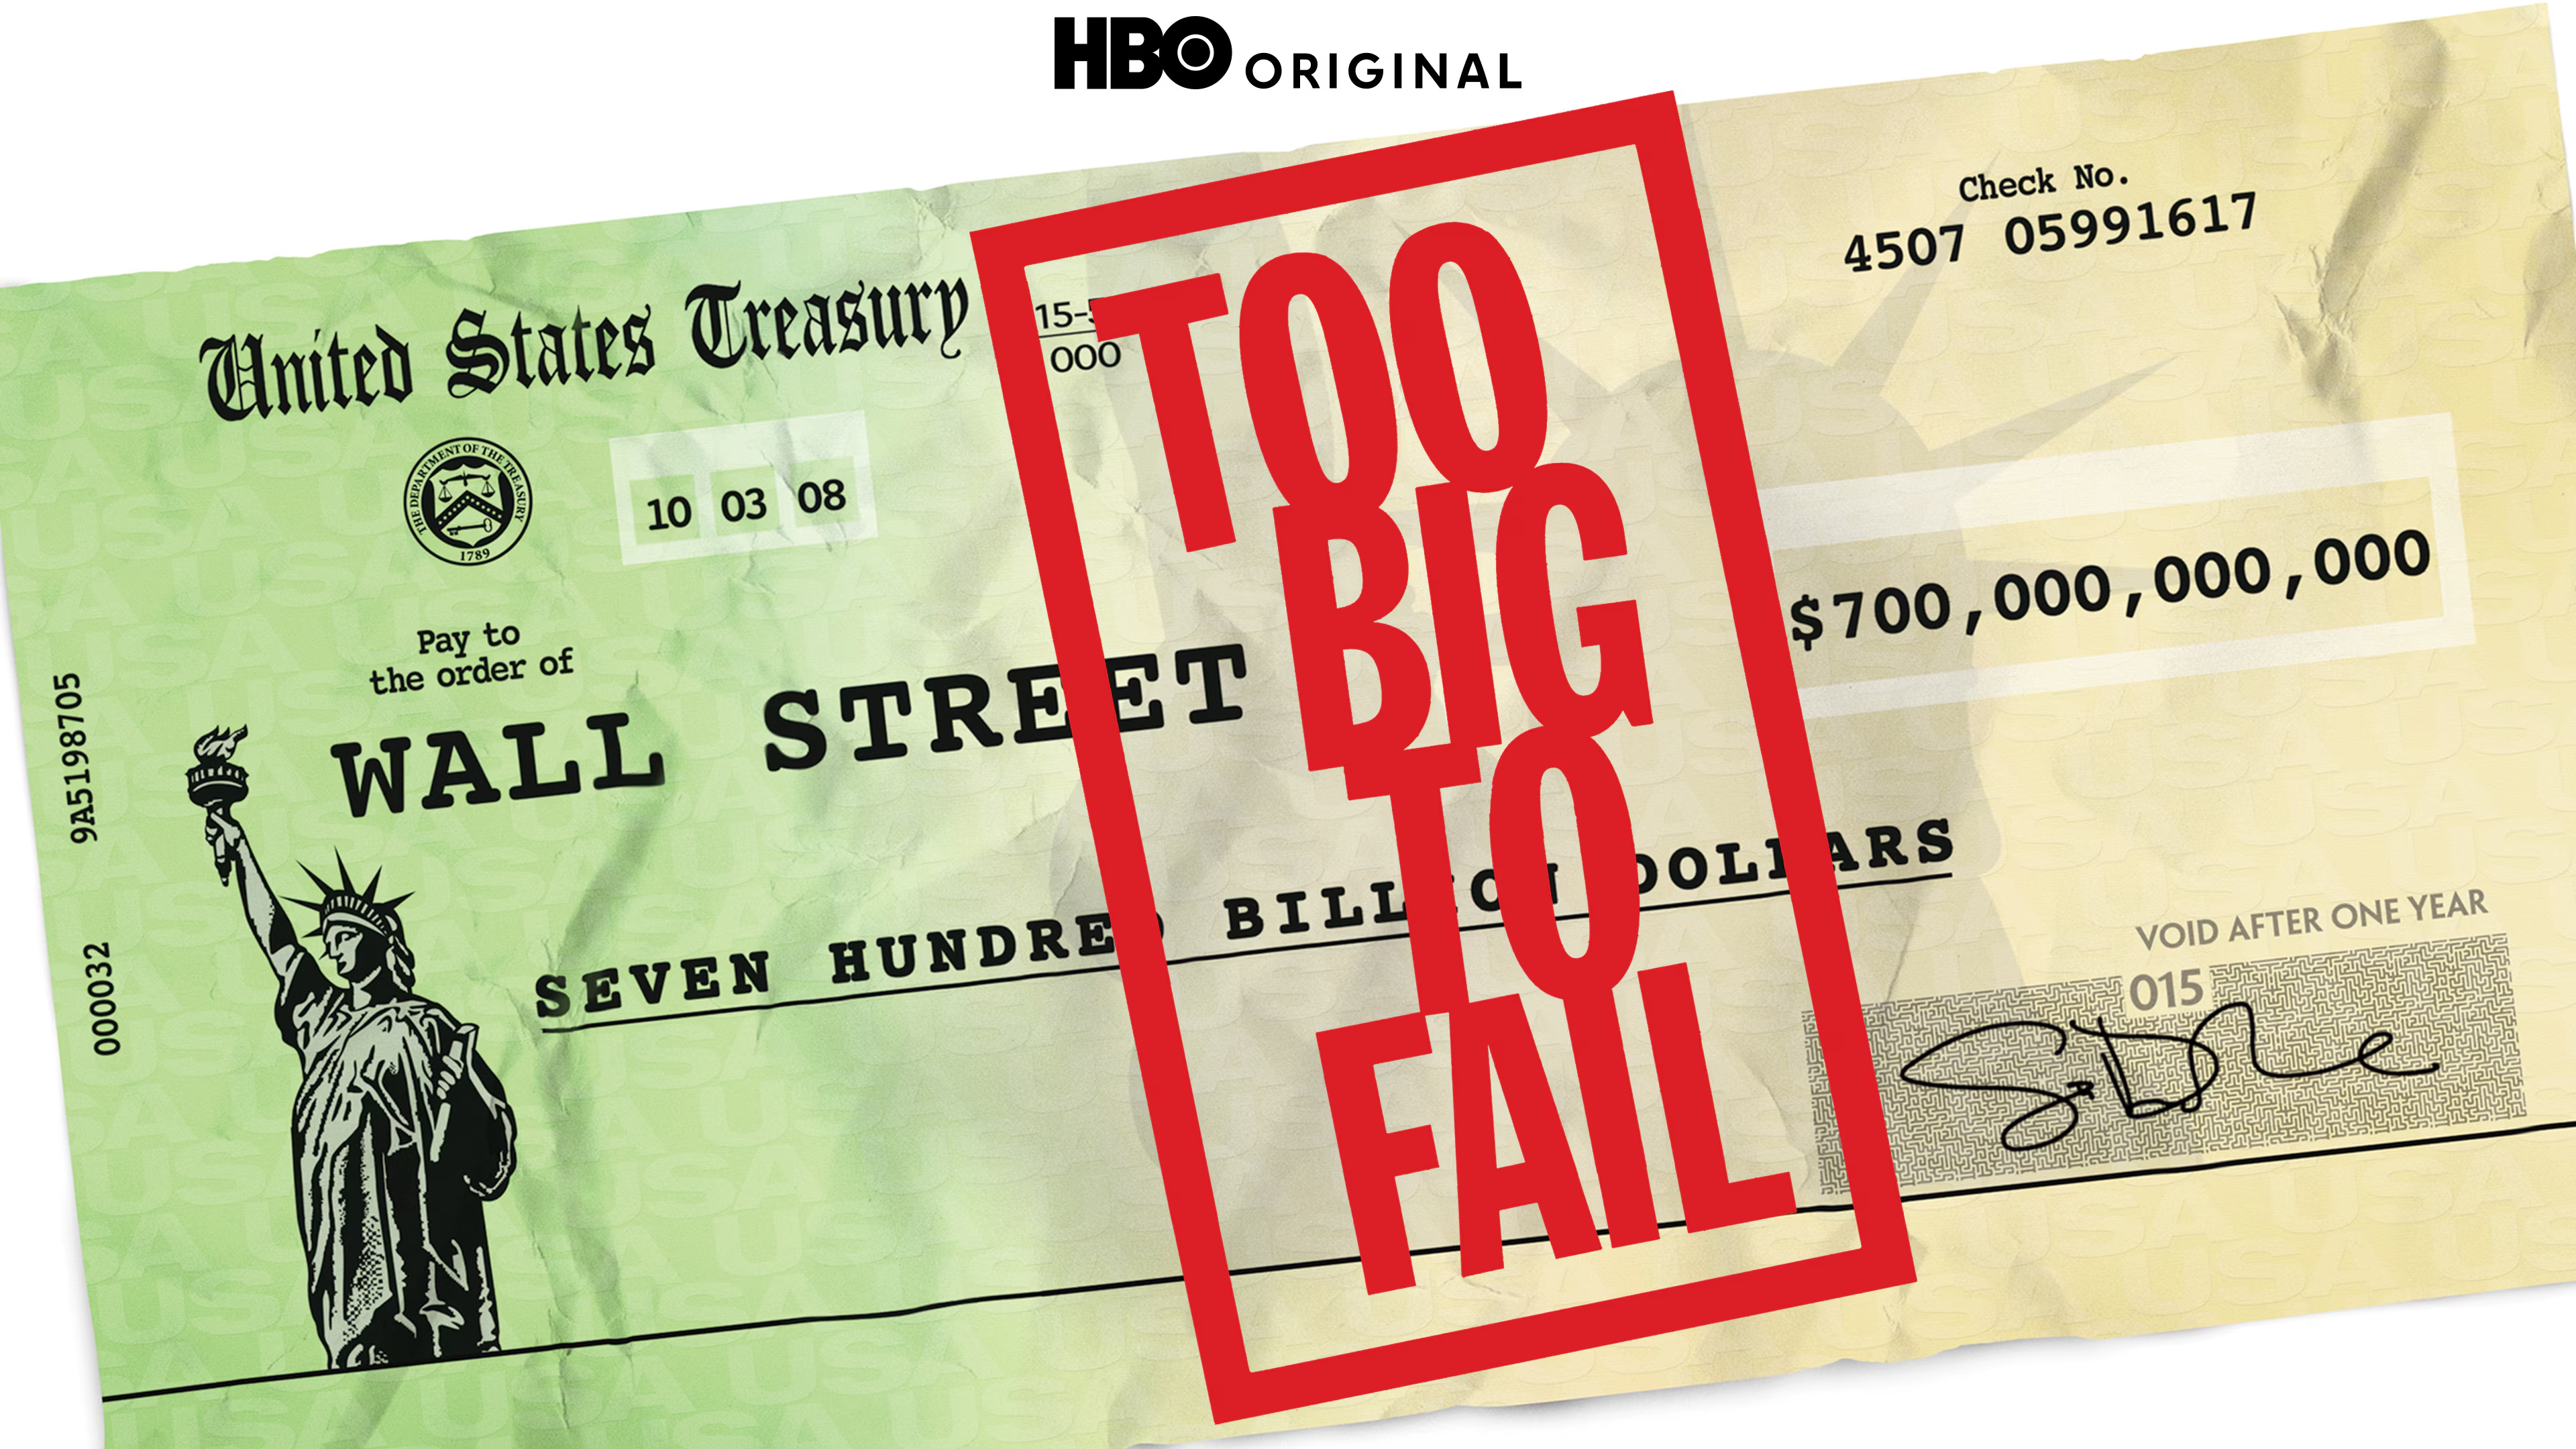
I don't listen to rich experts looking out for their own interests. That's the big difference. They will do it again, knowing there are no downsides. The concern here isn’t a simple: “experts are evil.” It’s that financial incentive structures do matter. If the lesson learned in 2008 was “the government will step in to prevent collapse,” then a similar risk will build again. Capitalism that isn't allowed to fail is worse than communism because it rewards failure. Communism doesn't have that kind of mechanism; when it fails, there is no reward.

Shoresy
 I mostly think the people who say to let the system burn are just bein hard asses who think theyre cool cause they sound tough. Even tho their position taken to the logical conclusion makes no sense


If it's a system that primarily benefits rich people, and unlike you, I don't have selective tribal outrages regarding rich people, then yes, that system needs to pay the price and fail, and not have working people pay the price for them.

Shoresy

That sounds exactly like the kind of excuse your "experts" would give you to spread around. That it's only bad when the other tribe does it and only good when their tribe does the exact same thing.


A lot of the examples you gave were for the public good so I have no reason to share your outrage.
Free market is generally best but theres no reason to be dogmatic about it. Plus crony capitalism is way worse under republicans


That's an insanely dogmatic take, and you probably don't even see it that way. How could you possibly come to the conclusion that "a lot" of those examples were for the public good if you had the capacity to think for yourself? Most of the examples had zero reasons to be of any benefit for the working class, and even your cherry-picked minority example of propping up failing banks is massively detrimental to the working poor as it basically rewards rich people for screwing poor people over with risky financing knowing they will force the working class to pay them back with debt and taxes later while paying experts to brainwash them to say "it's for your own good"...ensuring it will happen again and again...